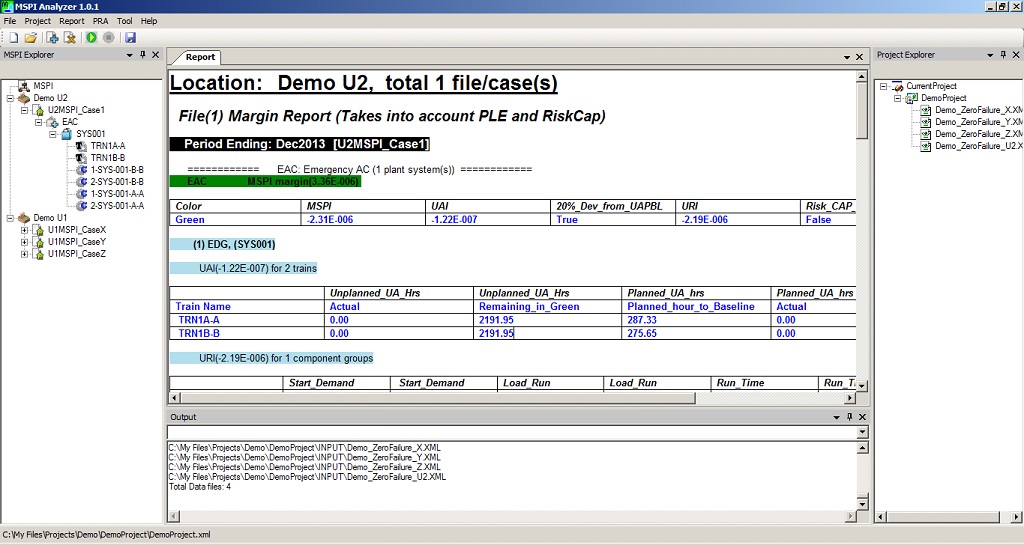
Main Application Window
Introduction to MSPI Analyzer
The purpose
MSPI (Mitigation System Performance Index) is the risk-informed performance index and important part of the Reactor Oversight Program, which is the regulation mandated by Governmental NRC to nuclear power plants (NPPs) for nuclear power production.
MSPI, konwn as the sum of UAI and URI integrated with Risk Cap and PLE, is an index that reflects implicitly or explicitly the as-build, as-operated, as-maintained and as-planned Nuclear Power Plant (NPP). MSPI Analyzer is an independent stand-lone and Validated & Verified (V&V) software developed with the intention for providing PRA nad Engineering/operation insights for MSPI program.
Based on NEI 99-02 and beyond, this tool is an efficient, accurate and user-friendly tool for the MSPI Program of PWR/BWR in nuclear power industry. An alorithm has been developed in order to generate the margin and derivation reports, find the risk constitutes of the risk (Birnbaum) and maximize the possibile UA time and UR failure combinations with GREEN. This tool will support the plant operation, provide insights for the risk management, plant modifications and improvement of plant equipment availability and reliability
Correspondingly it makes MSPI look-ahead and proactive management action planning in advance and possible, and provides the risk information and insight for MSPI-informed decision making. It also provides many features in order to find better solutions or designs for achieving MSPI program excellence.
- Provide Margin report and Derivation report.
- Output Margin comparison, derivation comparison.
- Generate contributing Cutsets of basic event Birnbaum
- Provide Ratio Matrixes and objective functions for MSPI systems
The features of MSPI Analyzer
Efficient and User-Friendly
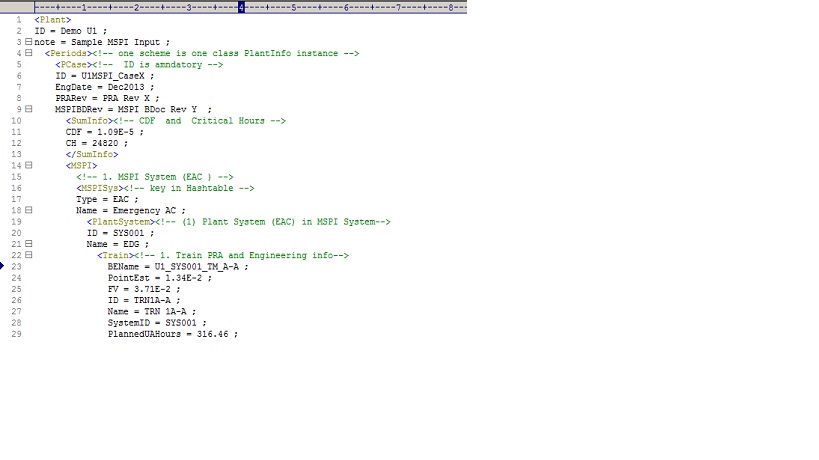
Standard Structured Input: The XML format input file is the simple text, one can directly work on the data source by simply edition: type and cut & paste.
Easy to Understand: the structured nested nodes to represent the plant operation data and PRA coefficients, simple format: Keyword = Value. Each piece of information is tagged or embedded within nodes and save in a XML file.
Input File Snapshot
Multiple Cases Management: Build projects for different applications or designs, each project can have multiple input files. All input files can be at same place, or grouped under different project.
Easy Calculation: All PRA parameters and engineering information are compiled into one node. One click is to run tens of cases for all MSPI related calculation.
Easy Edition: It is easy to manipulate all the MSPI input data/parameters. To add/remove the train for UAI or component for URI is as easy as to type/delete text, or cut and paste. When there is a design/modification that needs MSPI What-Ifs, it will take lots of resource to add or update correctly the PRA parameters and Engineering data in regulatory framework. MSPI Analyzer is an efficient tool to add/update/remove data. It will save lots of time when doing What-Ifs
-
Add a train
<Train><!-- 1. Component PRA Info FailtoStart,FailtoRun, FailtoLoadRun -->
BEName = U1_SYS001_TM_A-A ; PointEst = 1.34E-2 ;
FV = 3.71E-2 ;
ID = TRN1A-A ;
Name = TRN 1A-A ;
SystemID = SYS001 ;
PlannedUAHours = 216.46 ;
PlannedUABaseline = 1.13E-2 ;
UnplannedUAHours = 0 ;
UnplannedUABaseline = 1.7E-3 ;
</Train> -
Add a component
<Component><!-- 1. Train PRA and Engineering info-->
BEName = U1_SYS001_TM_A-A ; PointEst = 1.34E-2 ; FV = 3.71E-2 ; ID = TRN1A-A ; Name = TRN 1A-A ; SystemID = SYS001 ; PlannedUAHours = 216.46 ; PlannedUABaseline = 1.13E-2 ; UnplannedUAHours = 0 ; UnplannedUABaseline = 1.7E-3 ; </Component>
Easy Comparison: For each project, there can be as many cases as of interest. The margin and derivation reports of different cases can be easily compared.
MSPI Analyzer can provide derivation report and margin report of multiple cases of one unit, multiple units of one plant, or fleet, close monitor the MSPI performance.
Accurate
MSPI Analyzer has been implemented and verified in the real MSPI applications in Nuclear Power Plants: both PWR and BWR.
It provides more information other than MSPI margin and derivation, the software provide MSPI margin with 2 digits decimal, which is a more informative indication.
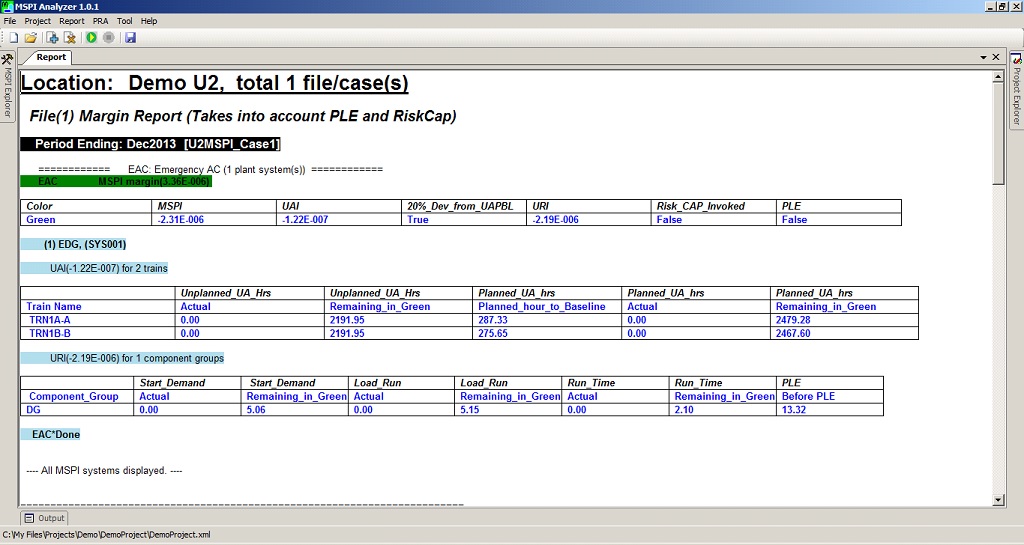
- MSPI margin report as INPO CDE format and more information.
MSPI Margin Report Sample
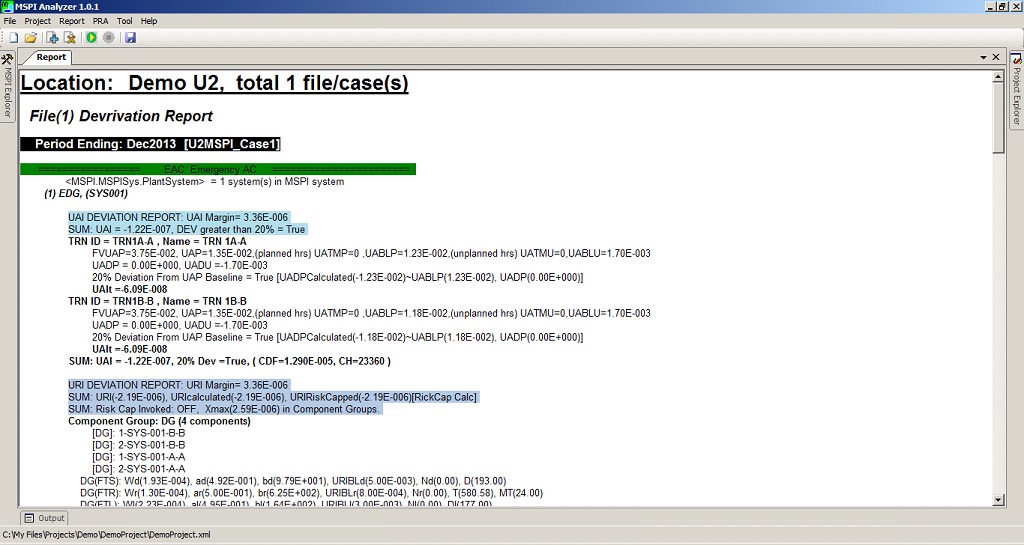
- MSPI derivation report with detailed calculation information similar to INPO CDE and more.
MSPI Derivation Report Sample
It provides the information what drives the Birnmaum of the basic events. It generates the cutsets of the selected basic event Birnbaum.
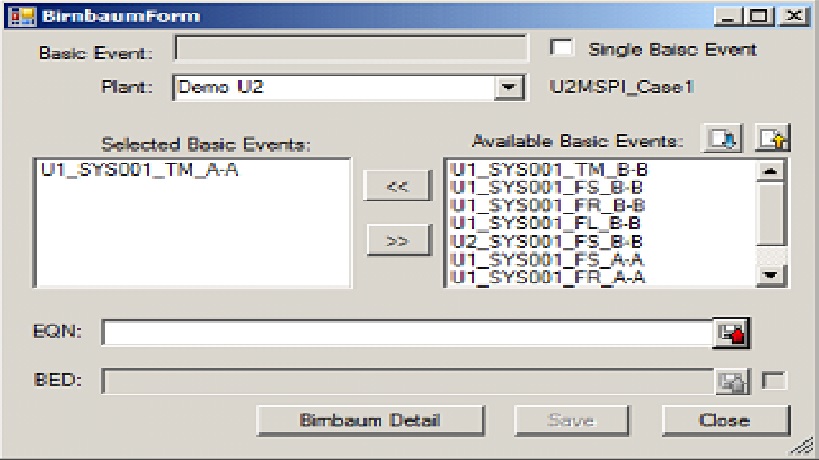
Generate Basic Event Birnbaum Cutsets
It provides detailed comparison of different designs of the same unit.
It provides optimization function and matrix to enumerate all GREEN (UA time and UR failure) combination to support the proactive operational decision making and suggest risk management.
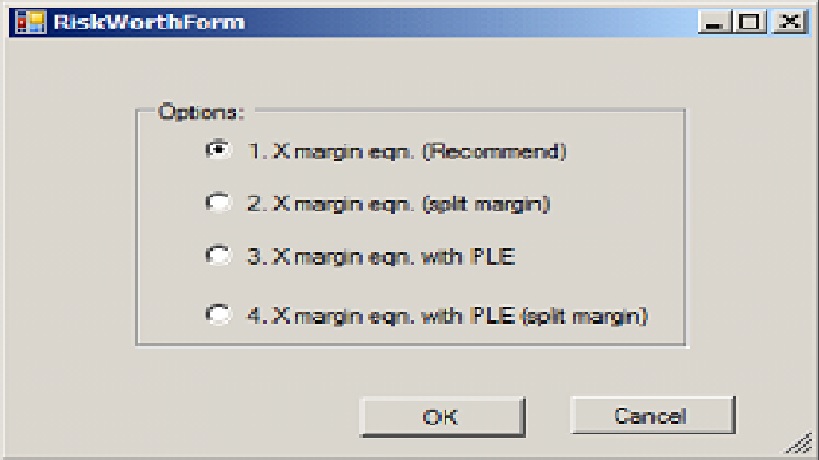
Create the Ratio Matrixes and Objective Functions
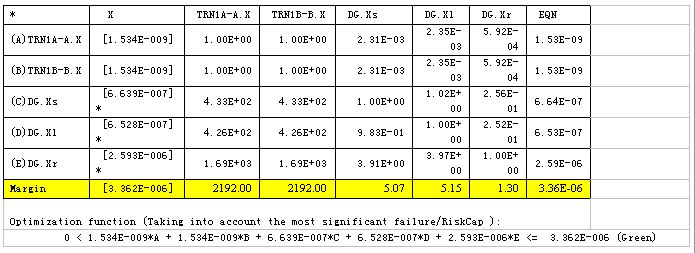
Given PRA values like FV, CDF, and basic event probabilities (calculated together with CCFs as the revised Birnbaum values), operation and engineering data as Critical Hours, Running Time, Demands and pre-defined baselines etc., the MSPI Analyzer can run margin and derivation reports and generate the objective functions of MSPI systems that are used to define all the possible GREEN combinations and develop the operation envelope once for all. This means all the possible cases of maximum MSPI margin within GREEN of available UR failures and UA hours can be pre-determined once the PRA model and plant designed and operation/engineering information are given.
For example, for the Demo U2, the ratio matrix and the objective function, which capture the relationship between the measures (MSPI margins) and the real UA time and integer UR failures which cause it to vary, of the Emergency AC Power System are
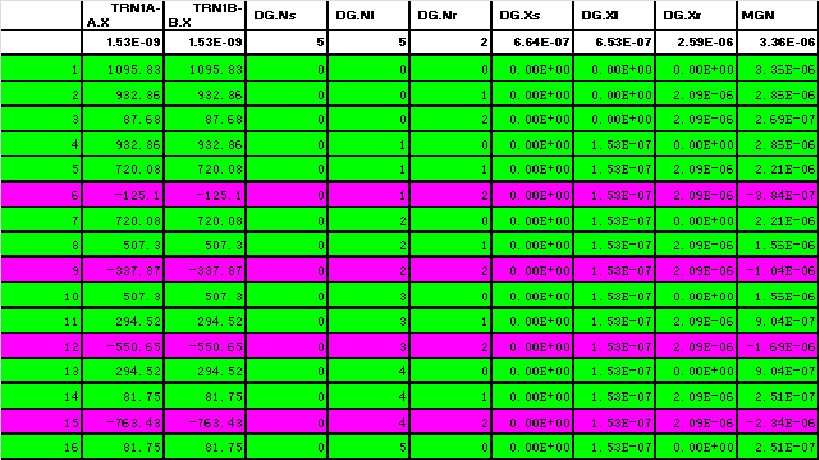
Subject to the Riskcap, Performance Limit Exceeded (PLE), the all UAI time and URI failures have to meet the equation above. All the GREEN conditions are boiled down to one equation. This is an integer and real number optimization problem. Since the maximum Fail to Start (FTS) margin is 5, the Fail to Load/Run (FTL) margin is 5, and the Fail to Run (FTR) margin is 2, total possible failure combinations are 6*6*3 = 108, of which some are green and other cases are non-green.
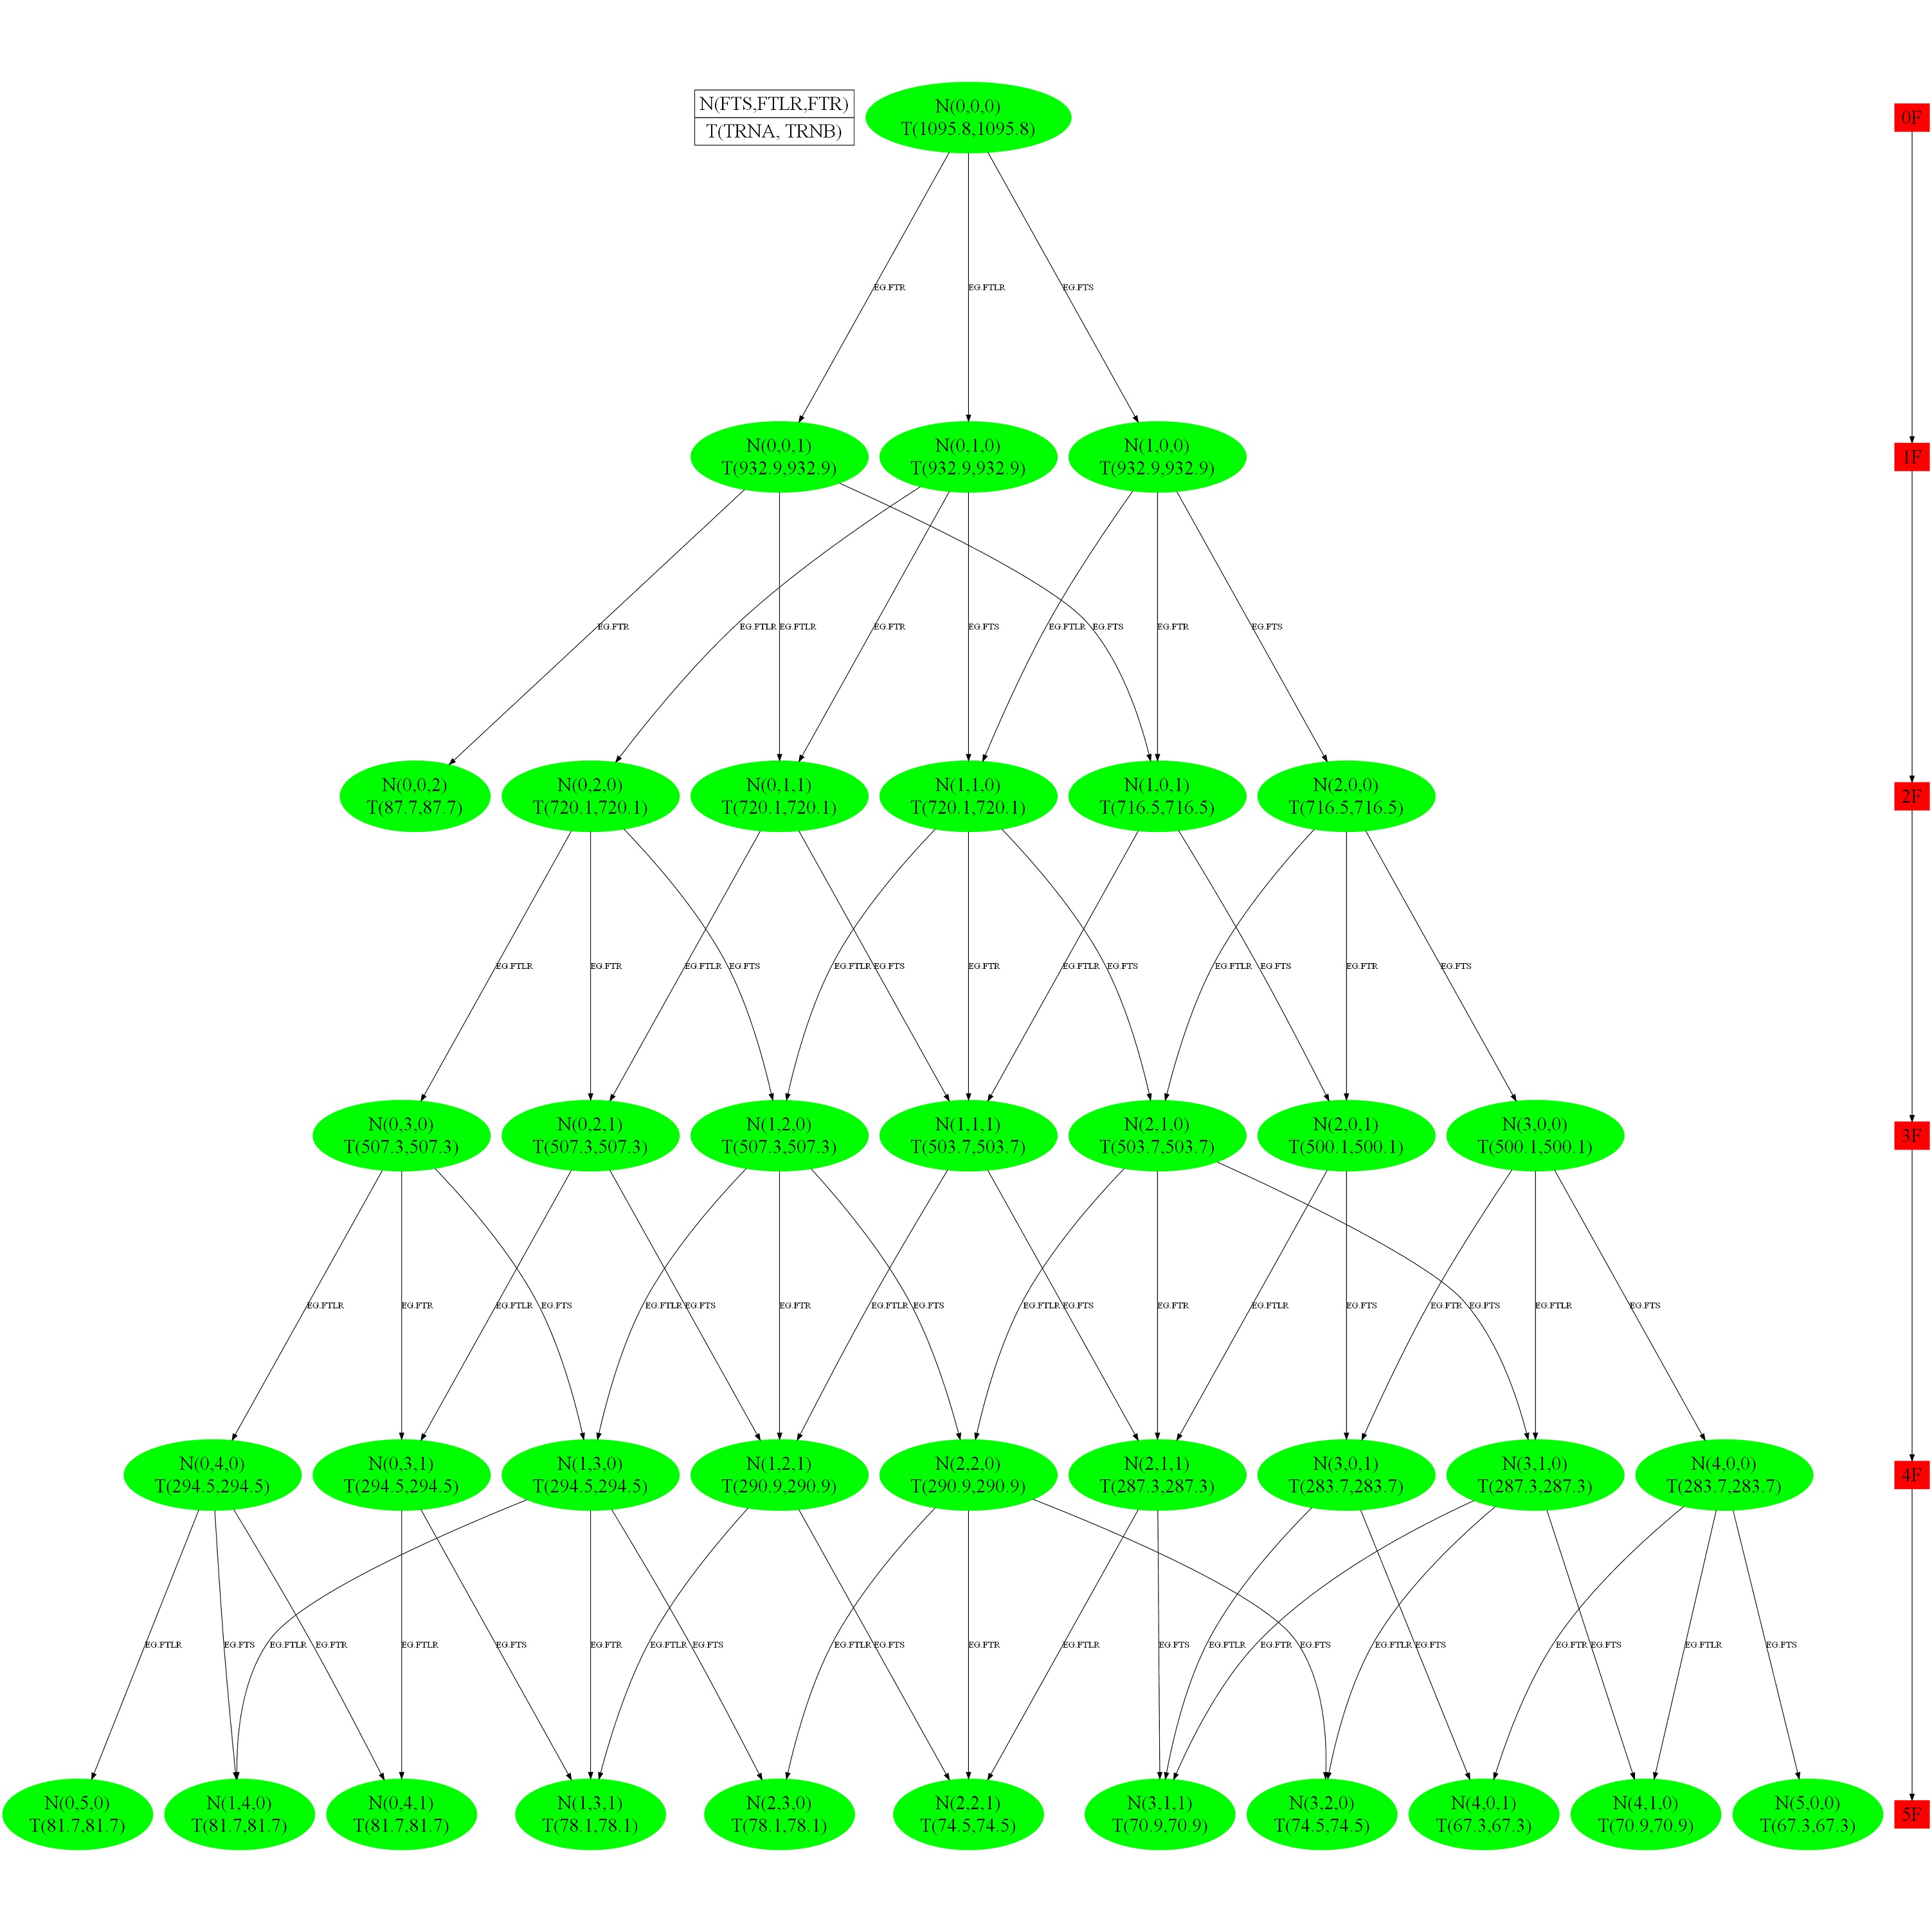
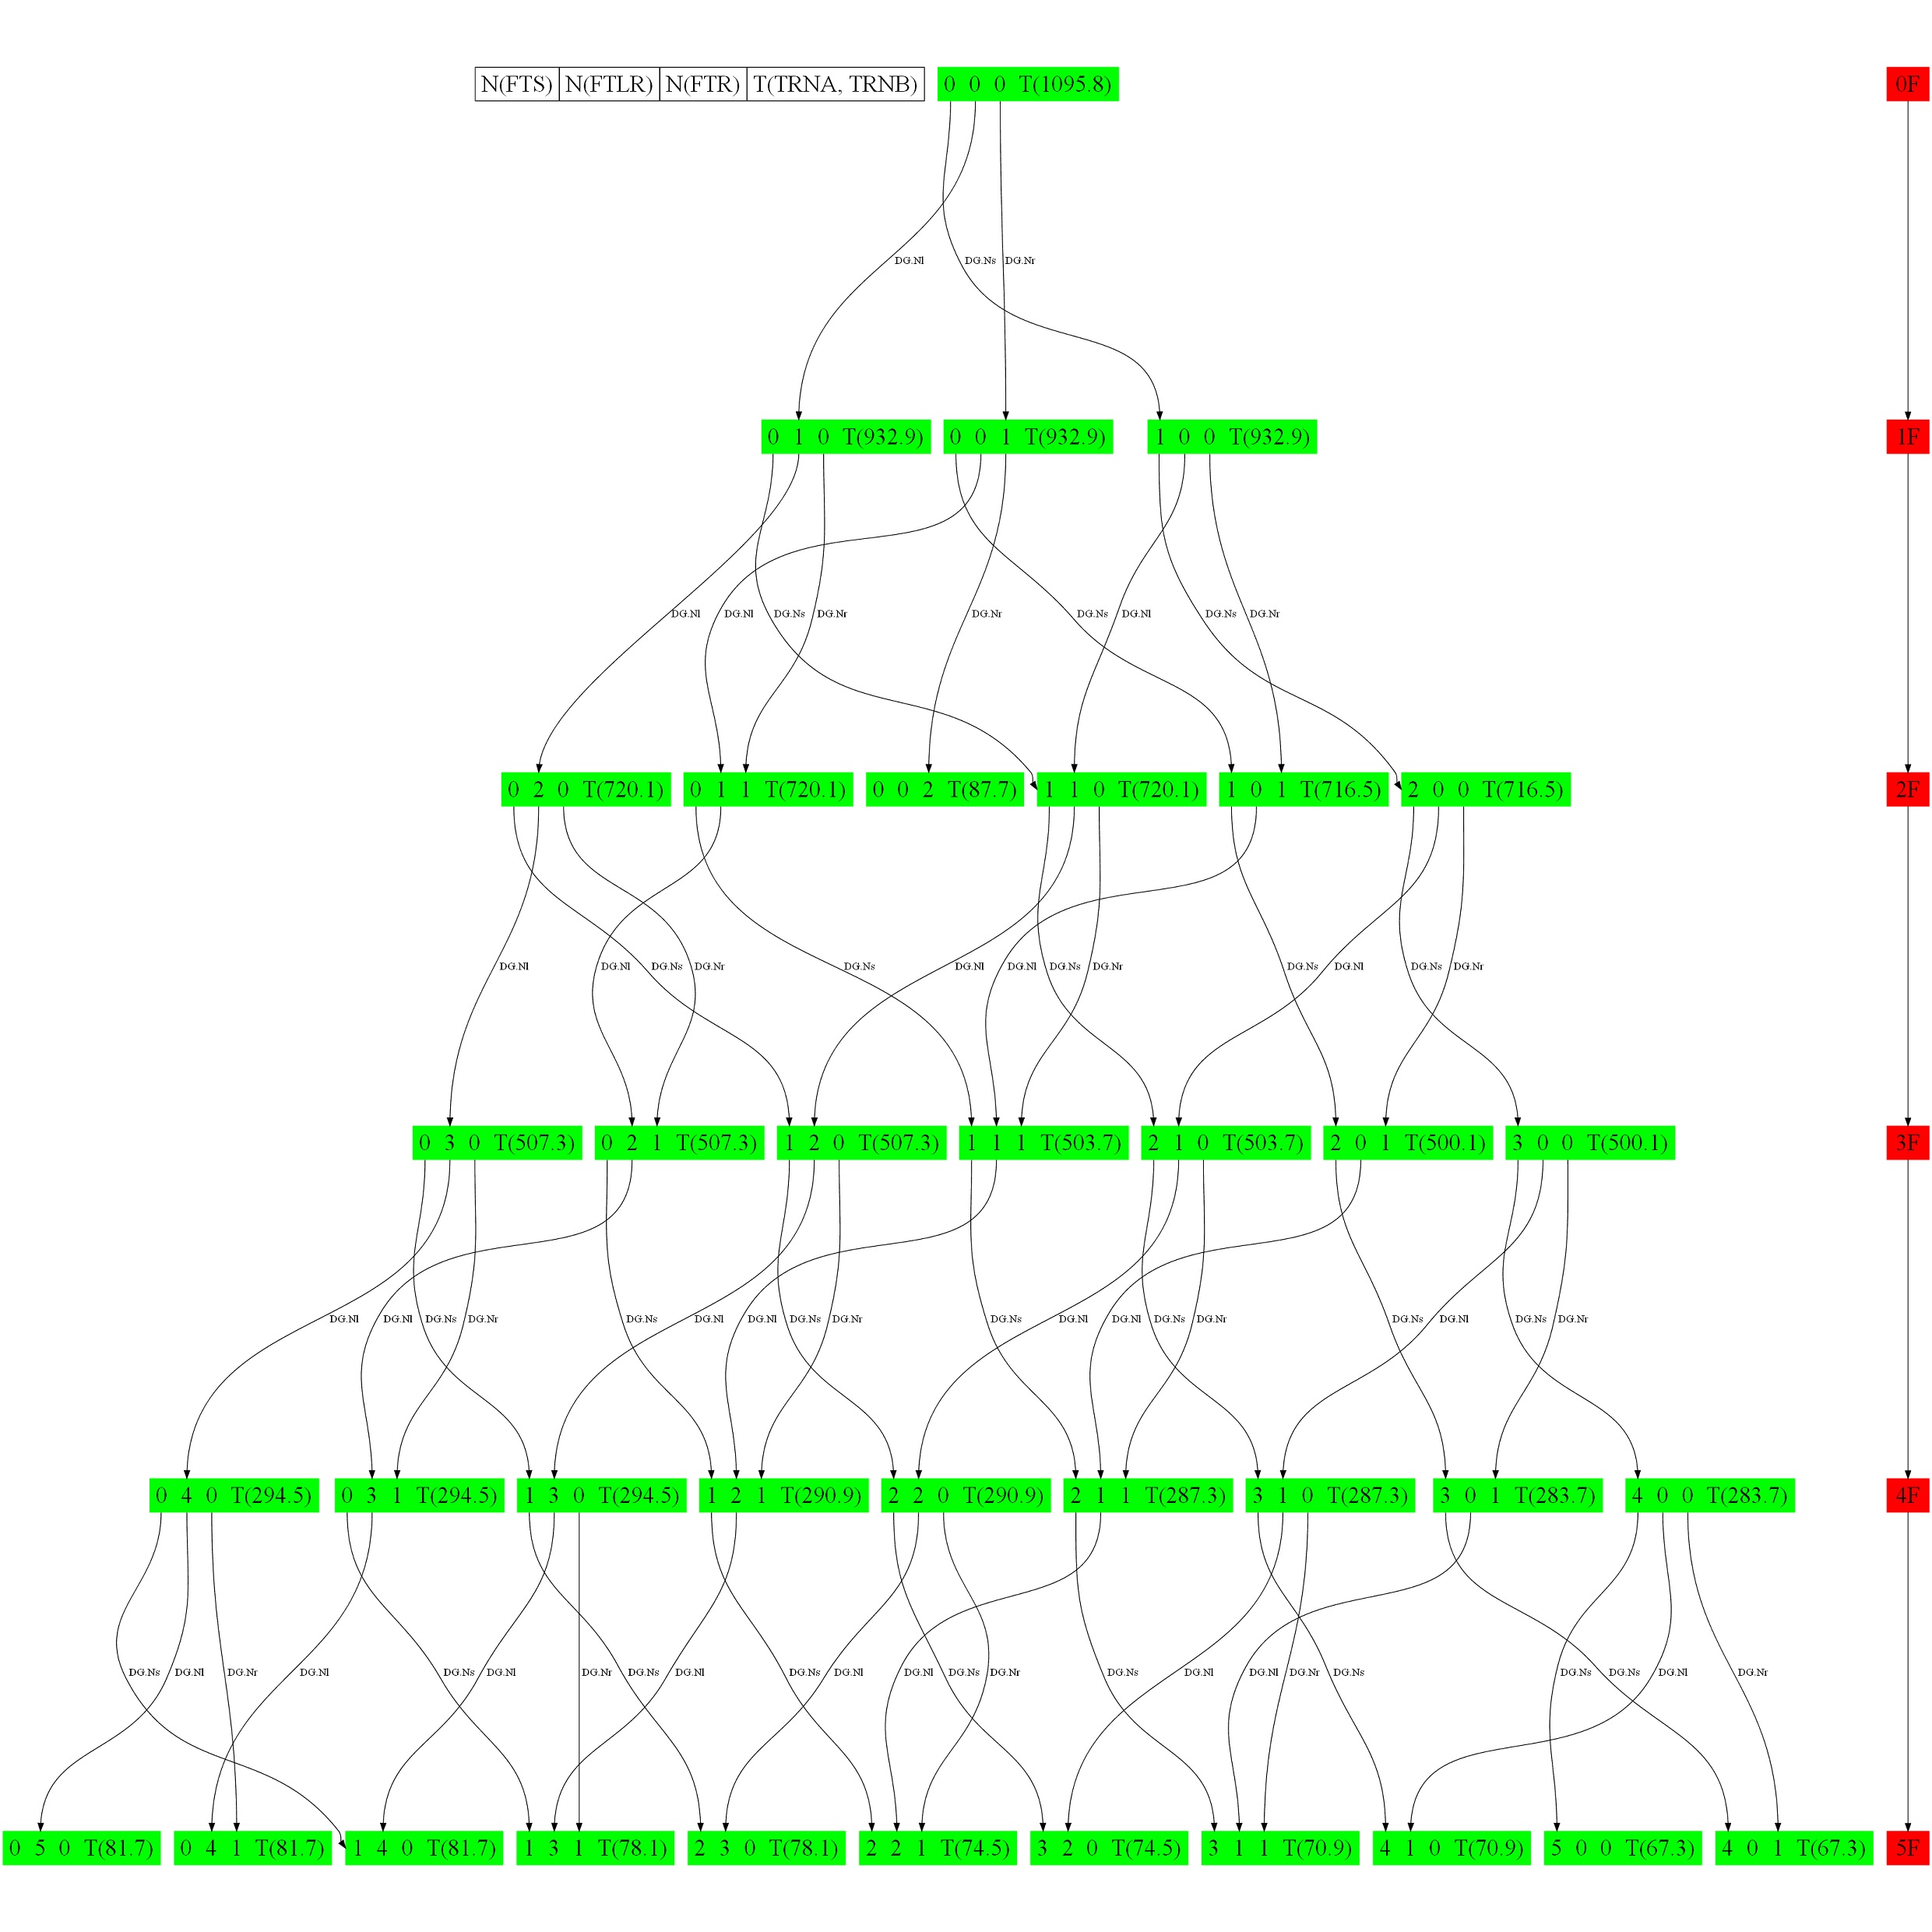
Of all 108 possible cases, only 37 are GREEN. Given the maximum single failure mode margin with others zero margin, all possible GREEN cases can be derived from one equation for EAC system. Other MSPI systems have their own optimization equations and GREEN combinations.
Assume there is only one failure occurs at a time, the GREEN combinations can be ordered according to the number of failures. The MSPI sequence and scenarios can be determined in advance. This means if the PRA model is finalized for a time freeze point, the operating data is set (critical hours, demand, running hours), all the MSPI GREEN combinations can be defined in advance, and corresponding management action is able to be planned ahead of time.
Visualization of EAC GREEN Combinations (Maximum Green Margin)
The following is another form of visualization for the same EAC GREEN combination.
Visualization of EAC GREEN Combinations (Maximum Green Margin)
Acronyms:
BWR: Boiling Water Reactor
CCF: Common Cause Factor
CDF: Core Damage Frequency
FV: Fussell-Vesely
MSPI: Mitigation System Performance Index
NRC: Nuclear Regulatory Commission
PLE: Plant Limit Exceed
PRA: Probabo;ostic Risk Assessment
PWR: Pressurized Water Reactor
UAI: Unavailability Index
URI: Unreliability Index
